Fees are one of the few things in investing that are entirely within your control.
The Wall Street JournalOn the math of long-term investing

Don't take our word for it.

Read what these legends have to say about long-term costs

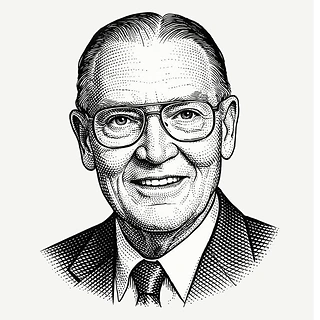
The miracle of compounding returns is overwhelmed by the tyranny of compounding costs.

John C. Bogle

John C. Bogle

Founder, Vanguard

1 of 21

How much are your advisory fees costing you over the long run?

The advanced calculator runs your time horizon against the actual S&P 500 return for each of those past calendar years, in the order they happened. Switch to the basic calculator at any time for a single assumed growth rate.

Market Returns (20 years)

20062025

Added to the asset-based fee, so it is charged to that path only.

S&P 500 total returns · 1986–2025

Replaying 2006 through 2025

19902000201020202025

Drag either green handle, or focus one and use the arrow keys, to set the first and last year of the window. Bar height and color are each year's actual total return.

Time frame

2006–2025

Annualized return

+11.00%

Flat monthly fee ($100/mo)

$7,954,000

Asset-based fee (1.00%)

$6,599,000

Flat monthly feeAsset-based fee (dashed)Fee gap: $1,354,000 so farVertical axis starts at zero.

Difference

$1,354,000

Same portfolio, same 2006–2025 returns, two fee structures: the difference after 20 years is $1,354,000, or 17.0% of the flat-fee ending value.

This window

Best year
2013 +32.39%
Worst year
2008 -37.00%
Down years
3 of 20
Realized annualized
11.00%

Asset-based fee* is modeled as an average over the selected time period. It may start above the selected average and decrease as the portfolio grows. This calculator is illustrative only, is not a forecast, and should not be relied on for a precise cost analysis. Values are nominal and before taxes.

Fund/ETF expense ratio of 0.00% is added to the asset-based advisory fee, for a total modeled load of 1.00%. The fund/ETF expense ratio you enter is added to the asset-based advisory fee, so it is charged to the traditional-advisor path only. It shows the total cost of that package. A flat-fee investor holding the same funds would also pay those fund expenses, which would narrow the difference shown here.

Historical mode replays actual S&P 500 calendar-year total returns in the order they occurred. Past performance does not guarantee or indicate future results, and no projection here is a forecast. Index returns are not investable: you cannot buy an index directly, and index figures include no fund expenses, transaction costs, taxes, or advisory fees except those you enter above. You choose the first and last year shown; a different period produces a materially different result. S&P 500 Total Return Index, calendar years 1986–2025, dividends reinvested, nominal (not inflation-adjusted). Source: S&P Dow Jones Indices.